Case study / Precision manufacturing
An inspection form is only
the start of the workflow.
I built a digital inspection system connecting engineering requirements, shop-floor measurements and usable quality data. Engineers defined what to measure; operators recorded the results during production.
- Environment
- Precision manufacturing
- Users
- Quality engineers + operators
- Focus
- Inspection, SPC & alerts
- 01Engineer defines inspection
- 02Operator records measurements
- 03SPC, alerts & quality data
Anonymised project. All interfaces are representative reconstructions with fictional measurements and part details; they are not original production screenshots.
01 / Define the inspection
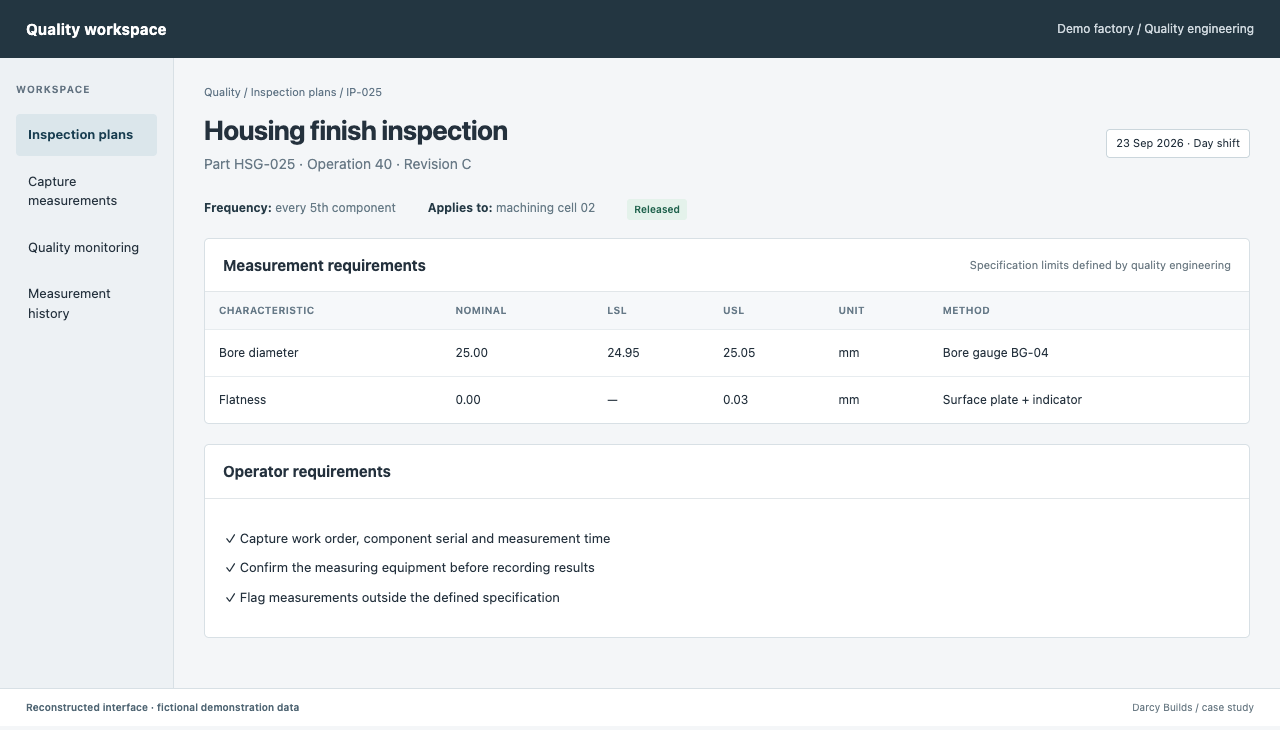
The engineering definition comes first.
Quality engineers define the characteristics, nominal values, upper and lower specification limits, inspection frequency and measurement requirements.
02 / Capture at the point of work
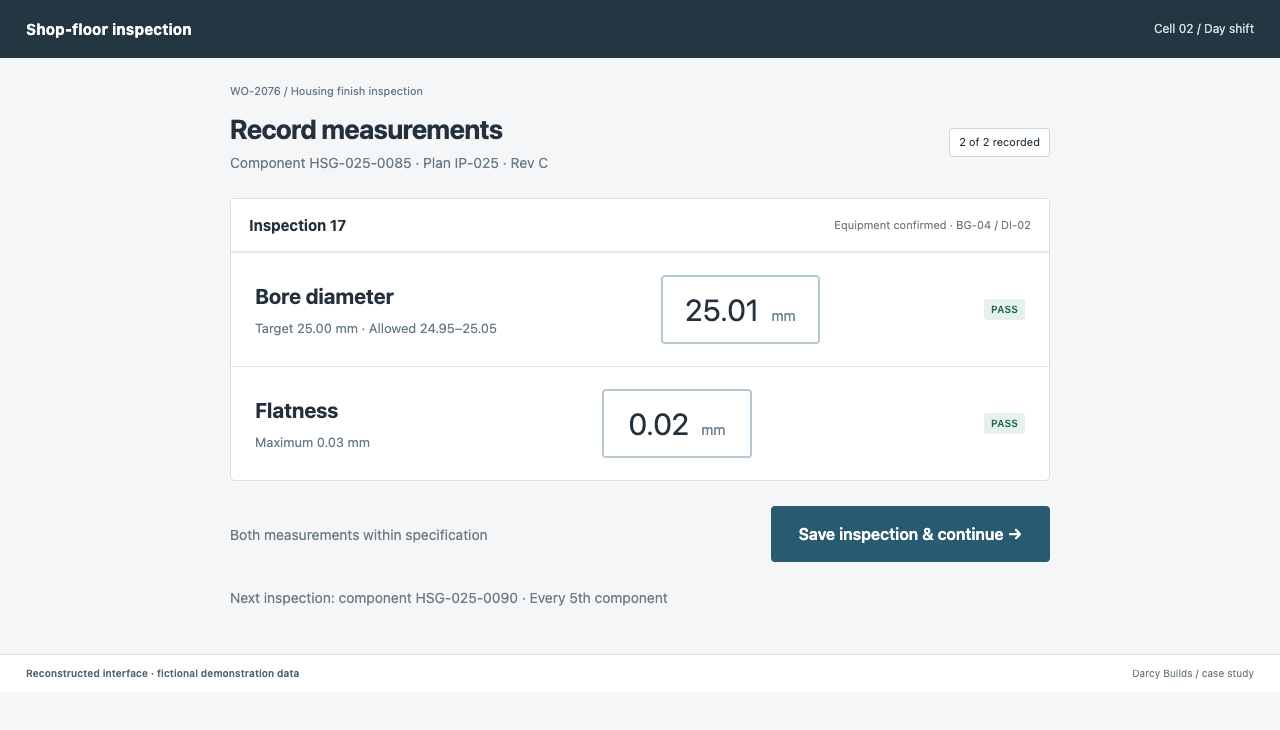
A clear, simple view for the operator.
The operator receives the defined inspection and records the measurements during production. Large controls and clear pass/fail feedback keep the task focused on the part in front of them.
03 / Use the data
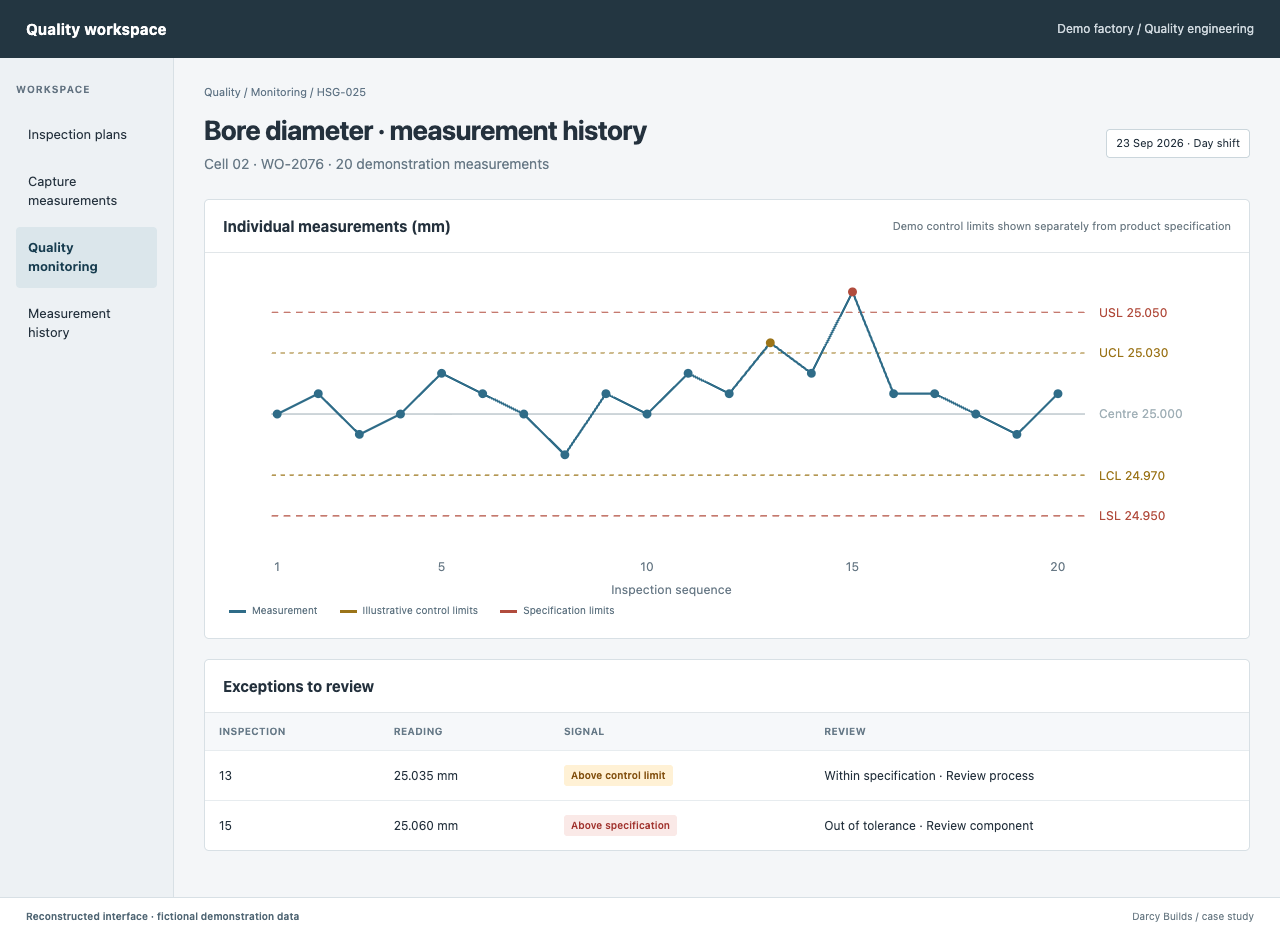
Measurements that feed the quality workflow.
Structured records can feed SPC charts, trend monitoring, out-of-tolerance alerts and historical analysis. The measurements stay connected to the inspection rather than disappearing into paperwork.
What the build demonstrates
Designed for both sides of inspection.
The engineering team needs a precise definition of the measurement. The operator needs a simple way to capture it. Connecting those two views creates structured data for quality monitoring and process analysis.
Have a similar operational gap?
Show me the spreadsheet
Send me the spreadsheet, form or workflow that’s causing the pain. I’ll tell you whether I’d build something, improve what you already have, or leave it alone.